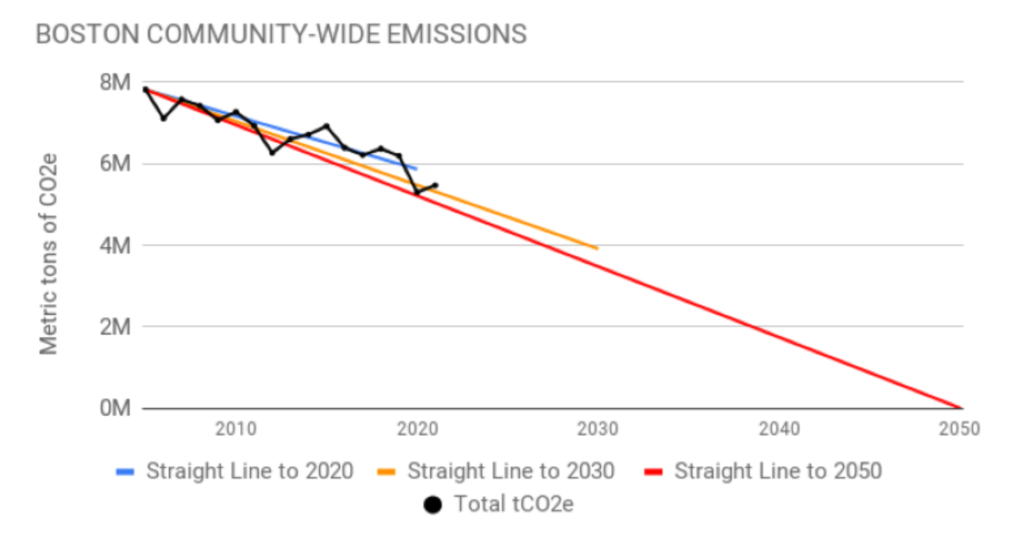
The City of Boston invites review of its community and municipal greenhouse gas inventories. The data, available on the City’s Environment Department webpage, is compelling: “In 2021, the Boston community emitted 5.4 million metric tons of greenhouse gasses (GHGs) from energy use in buildings and transportation. This is nearly a 13% decrease from 2019, when Boston emitted 6.2 million metric tons, and a 30% decrease from 2005, when Boston emitted 7.8 million metric tons. This decrease is exceptional and may largely be attributed to lower use of electricity and natural gas (also known as methane gas) and reduced vehicle travel during the COVID-19 pandemic. Citywide emissions are reported by calendar year. Boston achieved its 2020 climate goals of reducing emissions from both citywide activities and from local government operations by 25% below 2005 levels. The next citywide target is a 50% emissions reduction by 2030.
The reduction in Boston’s emissions has occurred at the same time that the population and the number of jobs in Boston have increased. The Boston community has grown from 521 thousand residents in 2005 to more than 654 thousand in 2021. Emissions per resident over the same time period have decreased 44%, from 15 to 8 metric tons per year. Boston’s economic growth, as measured by Gross City Product (GCP), has increased from 106 billion dollars to 156 billion. Emissions per million dollars of GCP have decreased 54%, from 76 to 35 metric tons per million dollars.”
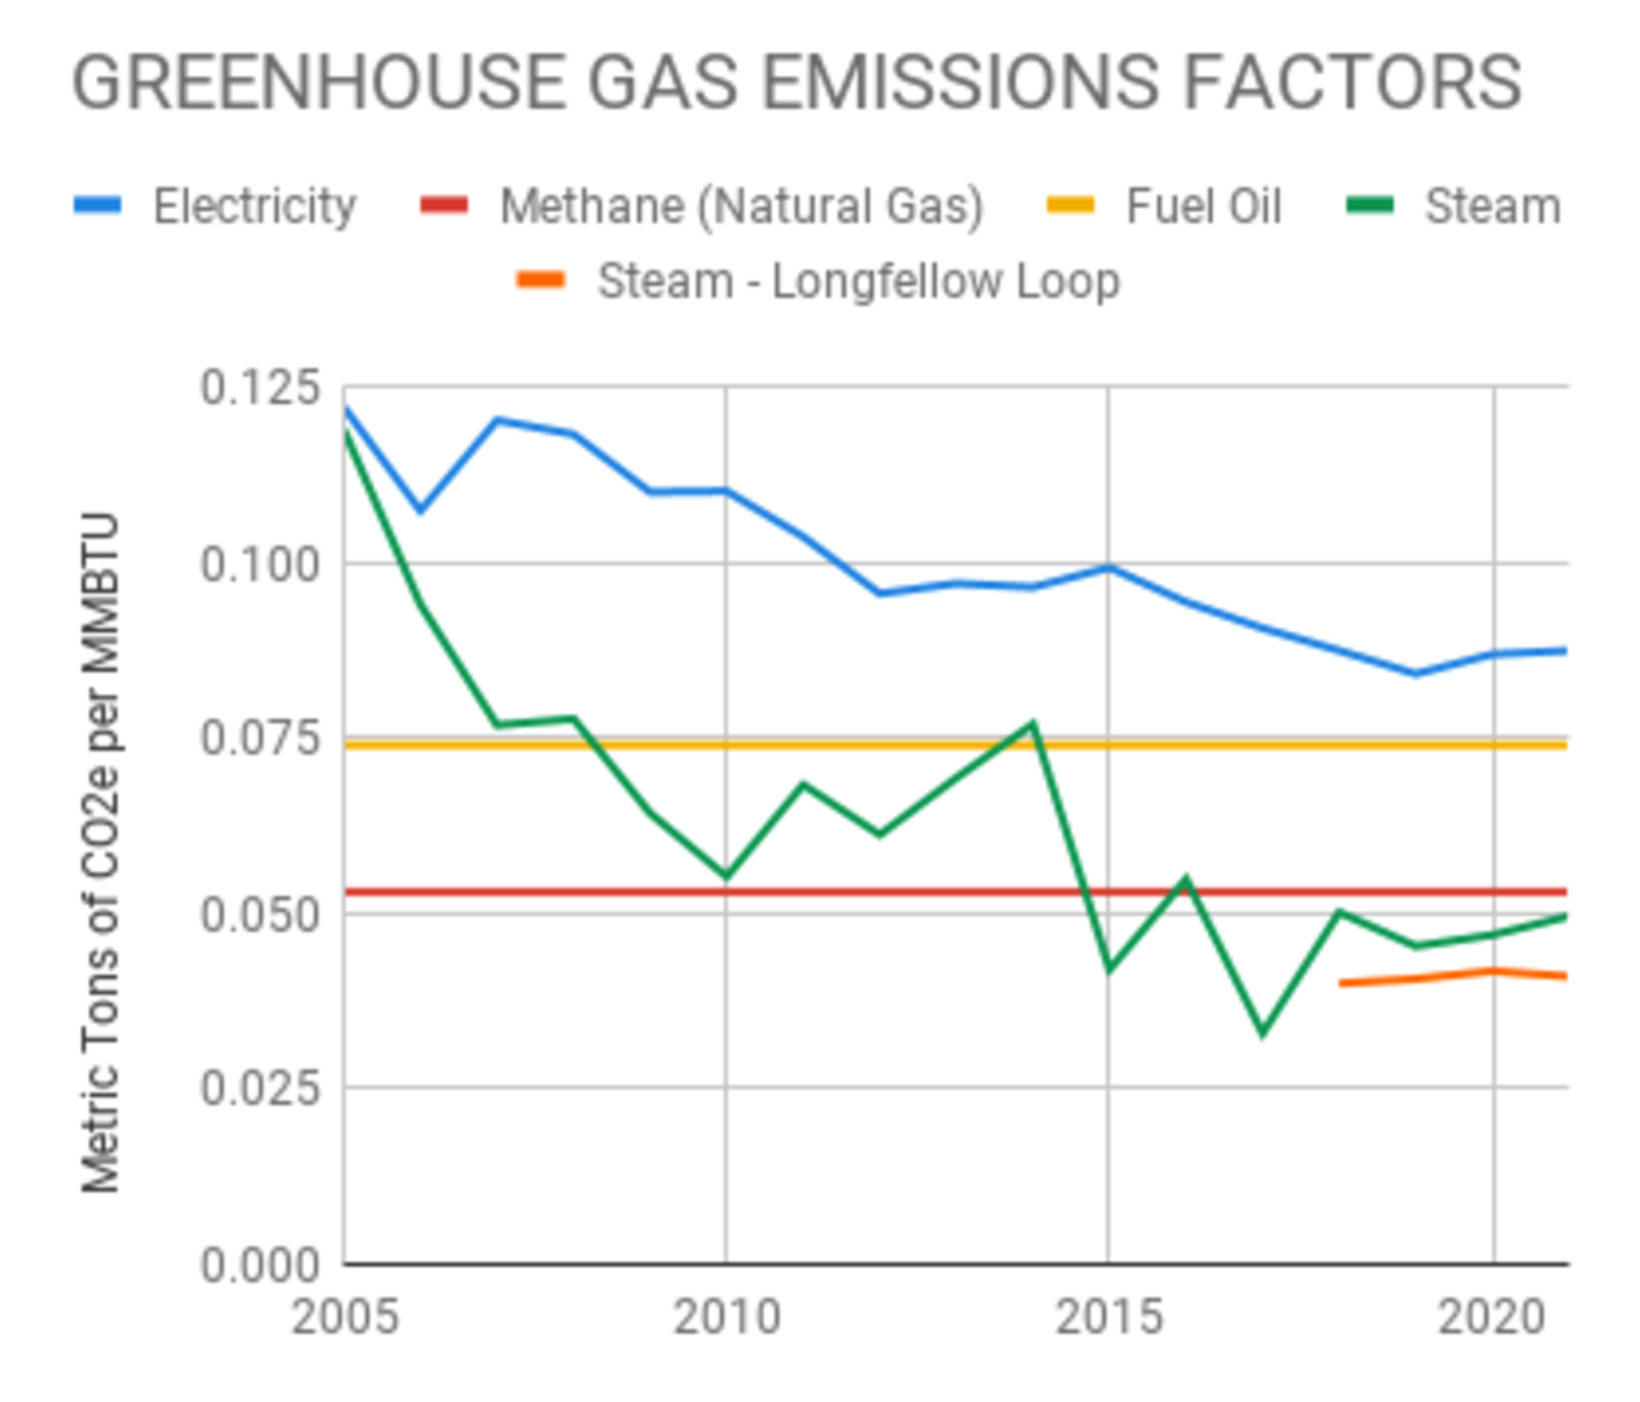
The webpage also charts total emissions by community and municipal sector (stationary, transportation, waste, etc.) and identifies the factors driving the changes.

Graphs: City of Boston Environment Department


